George Divoky's 2018 arrival on Cooper Island for his 44th field season. Image Credit: Craig George
George Divoky’s 2018 arrival on Cooper Island for his 44th field season. Image Credit: Craig George
June 19, 2018, after several weather-related delays, Search and Rescue pilots transported George and his gear to Cooper Island. His cabin is packed floor to ceiling with supplies stored over the winter, and he arrived with 800 pounds of equipment to support his 44th season studying Arctic seabirds.
While the Arctic has experienced back-to-back record-breaking years of warming, Utqiaġvik and North Slope of Alaska encountered unusually cold weather and snowfall this spring. According to George, he hasn’t seen conditions like this since the 1970s.
The most recent image of NOAA’s Earth System Research Laboratory (ESRL) Barrow Observatory show snow accumulation in the middle of June 2018. Image Credit: NOAA ESRL
He predicts the late snowmelt will make this season particularly difficult for his Black Guillemots, who are already struggling to adapt to an ecosystem imperiled by climate change.
The delayed breeding season means the parents will have to fly farther to reach retreating sea ice in order find food that is ideal for guillemot chicks.
The longer distance means the parents expend more energy, which is a precious commodity for seabirds. In Far from Land, Michael Brooke writes, “Natural selection will favour individuals which do not imperil their own long-term chances of survival by recklessly over-investing in any single year’s offspring.” Brooke adds that it is better to forgo a single year’s offspring in the hopes of future generations of potential chicks, because seabirds like albatross and guillemots tend to lay small clutches of eggs. The Cooper Island birds typically lay two eggs each year.
Based on previous year’s data collected via geolocators George uses to track the birds, he thinks they’ve been in Nuvuk for the last month. Also known as Point Barrow, this headland is about nine miles east of Utqiaġvik. The guillemots are waiting for the snow to melt, George says.
“Snowmelt at NOAA’s Barrow Observatory typically occurs about a week before egg laying,” George noted on social media. “Female guillemots don’t ovulate until snowmelt allows access to the nest cavity.”
George waves goodbye from Cooper Island on June 19. Image Credit: Craig George
Once George sets up camp — which is no small feat alone in freezing temperatures — he’ll be sending us regular updates via satellite, which we will be sharing here. Follow us on Facebook, Twitter, and Instagram for the latest news and Arctic insights.
This story is part of an ongoing series titled Arctic Change centered around George Divoky’s 44th field season studying Black Guillemots, sea ice, and climate change on a remote Arctic island off the coast of Alaska. To donate and support Divoky’s work on Cooper Island, visit the Friends of Cooper Island.
George Divoky's Arctic summer home on Cooper Island seen in mid-May 2018. Image Credit: George Divoky
Polar bears are regular vistors.
George at work.
Cooper Island cabin photographed by Search and Rescue pilots in Mid-May 2018. Image Credits: George Divoky
In the early days of his field research, George Divoky slept in a tent, but retreating Arctic sea ice made Cooper Island more accessible to polar bears. In 2003, George installed a cabin and added an electric fence for protection. Snow seen in the photo above will provide additional drinking water during the season.
Cooper Island is 25 miles east of Utqiaġvik, formerly known as Barrow, in Alaska. In Iñupiaq — one of at least 20 Indigenous languages in Alaska and Canada — Utqiaġvik means a place to gather wild roots. It is the northernmost city in North America.
Cooper is a gravel and sand barrier island, only four miles long; it serves as a breeding ground for a small colony of Black Guillemots, which George has studied since 1975.
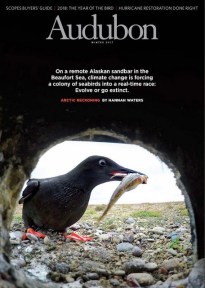
December cover of Audubon Magazine. Image Credit: Peter Mather for Audubon
The Black Guillemots arrive in early June and eggs should be laid several weeks later. George speaks of the birds with an affection most people reserve for other humans.
When the December issue of Audubon Magazine hit the stands with an eye-catching image of one of his feathered friends, he was genuinely excited, pointing out that she had fledged in 1996 and been nesting there since 1999. Of her descendants, several have returned to the island as well. She has 24 grandchildren.
George is eager to see who will return this year, and worried for the ones who might not.
This story is part of an ongoing series titled Arctic Change centered around George Divoky’s 44th field season studying Black Guillemots, sea ice, and climate change on a remote Arctic island off the coast of Alaska. To donate and support Divoky’s work on Cooper Island, visit the Friends of Cooper Island.
This Aqua satellite was launched in 2004; it collects about 89 Gigabytes of data per day about elements of the Earth’s water cycle -- including water in liquid, solid, and vapor form. Image Credit: NASA’s Earth Observing System
This Aqua satellite was launched in 2004; it collects about 89 Gigabytes of data per day about elements of the Earth’s water cycle — including water in liquid, solid, and vapor form. Image Credit: NASA’s Earth Observing System
In the Arctic, much depends on ice. Pack ice. Drift ice. Old ice. New ice. For some wildlife, ice provides safe haven from predators and for others, it offers access to prey. For humans, many of whom are living in isolated coastal communities with no roads in or out, ice is everything.
Sailors and explorers have kept sporadic records about ice conditions dating back thousands of years, but only since 1979, with the launch of Earth observing satellites, have streams of near-constant information about Arctic sea ice been available. Using images and observations captured daily, scientists are able to measure ice thickness, area of coverage, and seasonal fluctuations in the advance and retreat of ice coverage.
Real-time sea ice images and data are vital for the safety of researchers like George Divoky and for people in Arctic communities who depend on ice for subsistence hunting and fishing. Anthony Fischbach is a wildlife biologist for the United States Geological Survey (USGS) in the Alaska Science Center Walrus Research Program, where he has worked since 1994. Fishbach delivers a daily “Ice Mail” to just over 100 people interested in up-to-date information on Arctic sea ice. Subscribers include Divoky, scientists in Russia, and remote Inuit communities who may not have easy access to internet connections capable of retrieving large amounts of data.
“The main niche I’m trying to fill is a way to get meaningful sea ice imagery and charts in the palm of your hand or on the deck of a ship where you’ve got really minimal bandwidth,” said Fischbach. “If you’re in a remote community that has 2G cell phone connection or if you’re on an Iridium-linked vessel, the existing ways of accessing the data just don’t meet the need.”
He described his own experiences of working in Arctic coastal communities or being on board a retrofitted crabber, “We just struggled to get the data through the existing methods and we couldn’t get all the data we wanted.”
Today, Fischbach relies heavily on two satellites we’ll be following closely this summer — Aqua and Terra. Both are part of NASA’s Afternoon Constellation or A-Train, which is a convoy of satellites operated by NASA and international partners. The satellites travel together, completing a polar orbit twice a day; because of the Earth’s rotation, a polar orbit means that the satellites will observe the entirety of the planet’s surface every one to two days.
The A-Train crosses the equator at about 1:30 a.m and 1:30 p.m.; the Terra satellite passes the equator in the early morning, Aqua in the afternoon. This timing and repetition allows scientists to generate cloud-free images and to study how temperatures over land and water change from day to day.
By flying satellites loaded with a host of Earth-observing instruments in a formation, scientists are able to gather a great deal of meaningful data. According to NASA, flying in concert “allows for synergy between the missions—synergy means that more information about the condition of the Earth is obtained from the combined observations than would be possible from the sum of the observations taken independently.”
While each satellite is tasked with different mission objectives, the data from individual instruments can be combined to paint a more vivid and informative picture of the Earth’s climate and atmospheric systems.
This visualization shows the orbits of NASA-related near-Earth science missions that are considered operational as of March 2017. Video Credit: Greg Shirah for NASA Visualization Studio
A key instrument on board Aqua and Terra is a moderate resolution imaging spectroradiometer, or MODIS for short, which is capable of of observing across 36 spectral bands or wavelengths at different resolutions (250, 500, and 1000 meters). (A complete technical profile of this instrument and the data it provides can be found here.)
MODIS is an integral instrument for studying the ocean, because it aids in the creation of ocean color maps. Ocean color reveals much about phytoplankton productivity, which, according to NASA, forms the basis of the ocean’s food chain and plays a big part in carbon storage and movement. MODIS also allows for detailed maps of sea surface temperatures, which are known to influence weather patterns. Since MODIS is able to study water in liquid, solid or gas form, the instrument aids measurement of snow and sea ice and how much solar energy is being absorbed or reflected back to space.
This ice map for May 24, 2018, generated by United States Geological Survey (USGS) in Alaska, combines MODIS images from Aqua and Terra with National Ice Center data. Image Credit: Anthony Fischbach for USGS
Fischbach explains that the images in his daily emails (seen above) are processed with false color so you can distinguish the white of the clouds with the white of the sea ice; sea ice is aqua-colored and the clouds appear white. The images show detail down to 250 meter resolution, meaning you can clearly see objects that are 250 meters or 820 feet wide.
To people living and working in the the Arctic, these sea ice data could be comparable to monitoring hazards on roadways in the lower 48, because the ice and water provide access for both transportation and food.
The ice is moving constantly, which creates precarious decision-making choices in remote regions without the right information. With several days of ice data in hand, people in the field like Fishbach and Divoky can make better choices.
“I’d really like to know as much as I can about how the ice is moving. Is there more ice coming this way? Is it going to be congesting? Is it going to be opening up?” he asks. “You know, do I launch boat out in to the ice — the shifting seascape — where I could get pinned in and trapped and not make it home?”
This story is part of an ongoing series titled Arctic Change centered around George Divoky’s 44th field season studying Black Guillemots, sea ice, and climate change on a remote Arctic island off the coast of Alaska. To donate and support Divoky’s work on Cooper Island, visit the Friends of Cooper Island.


You must be logged in to post a comment.